Tutorial
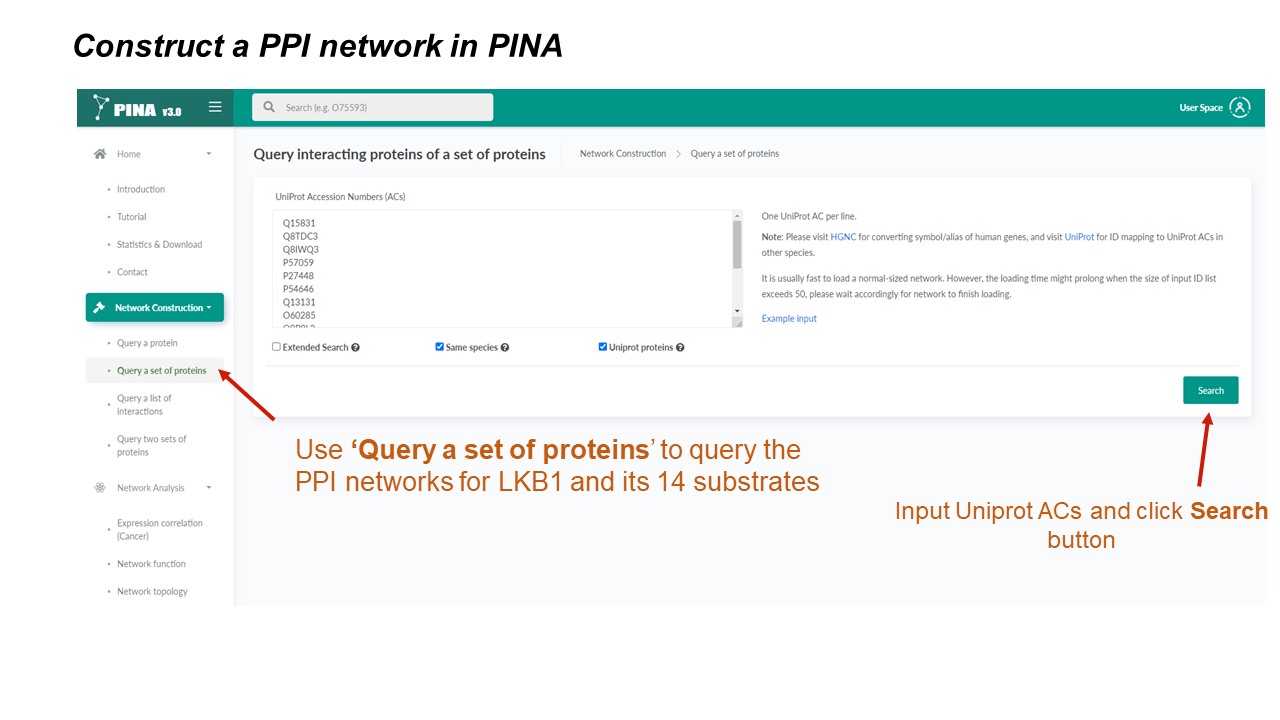
Network Construction
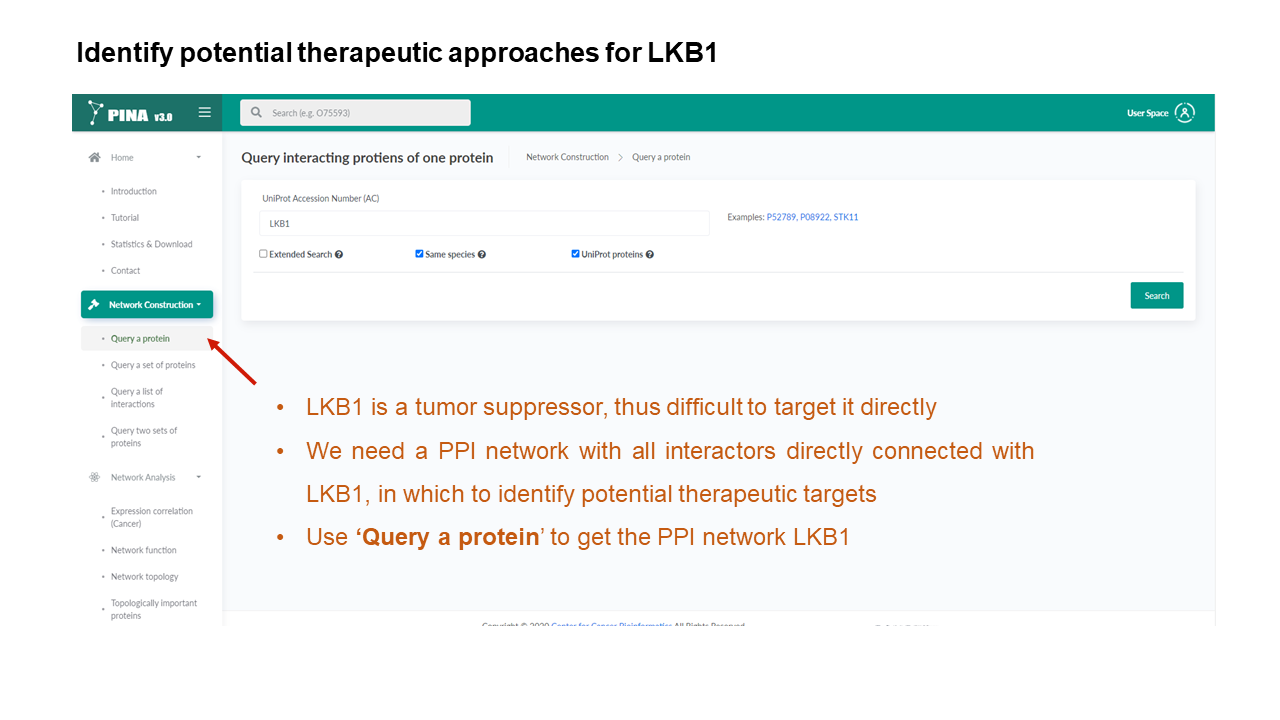
Generate PPI networks using flexible query options
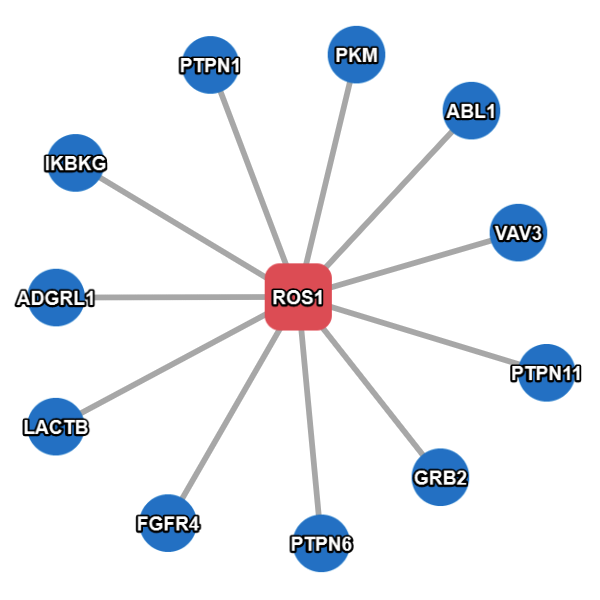
Example result without extended search.
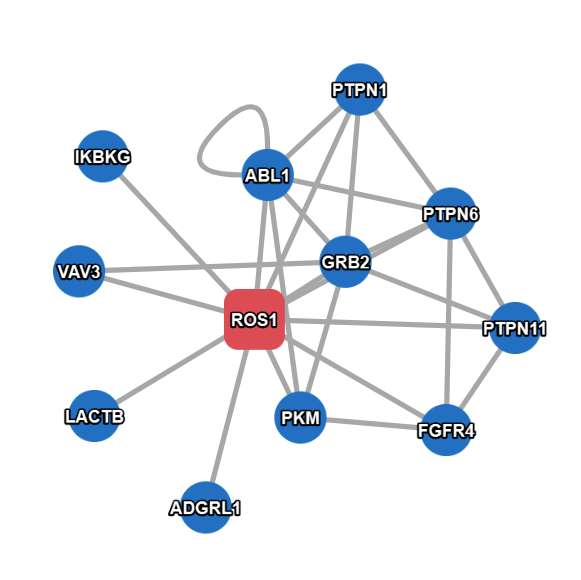
Example result with extended search enabled.
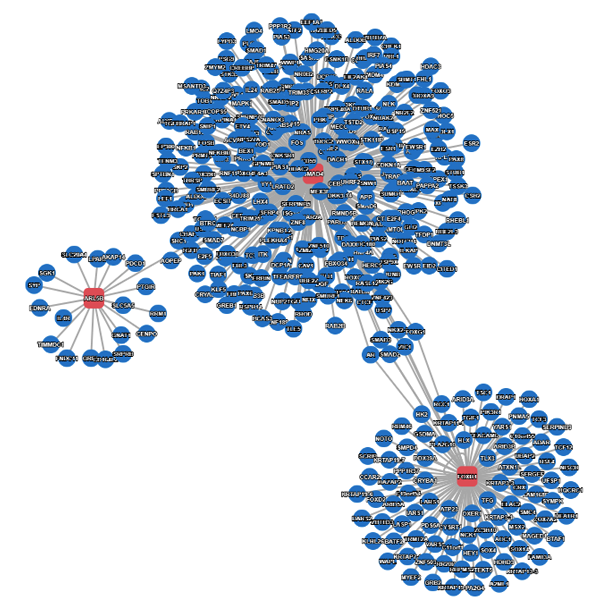
Example result without extended search.
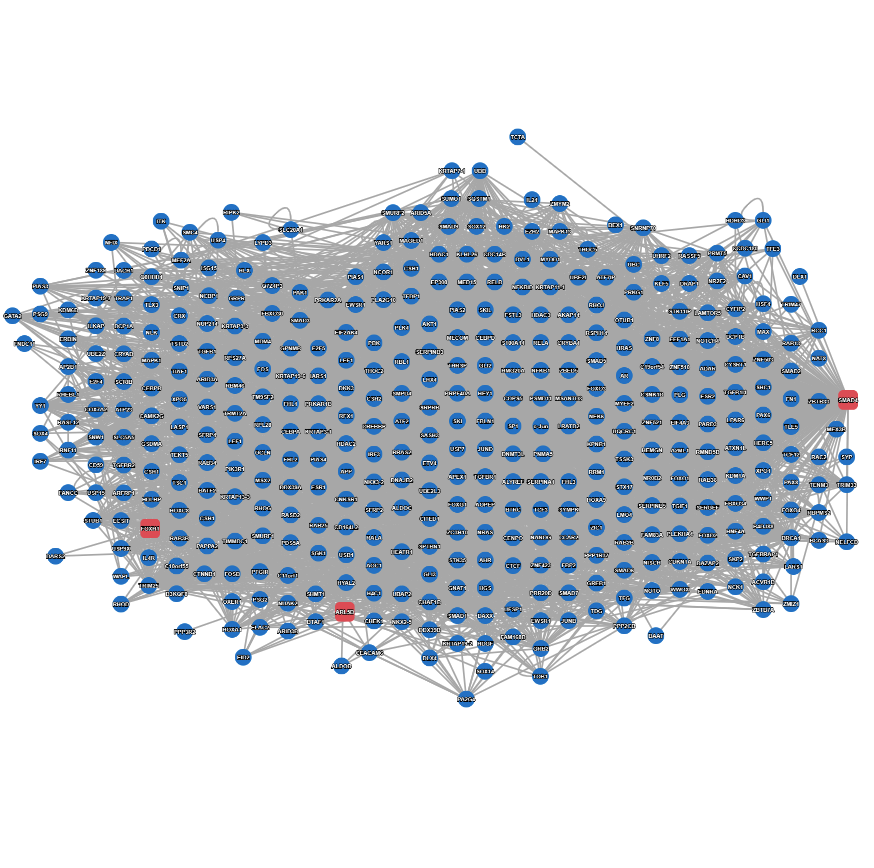
Example result with extended search enabled.
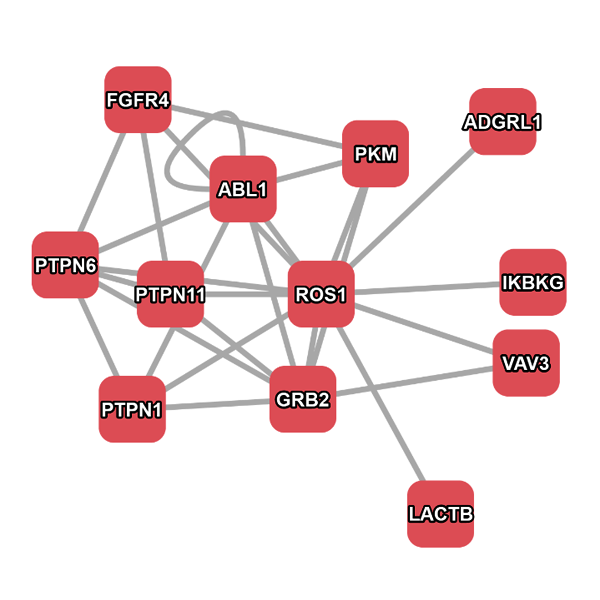
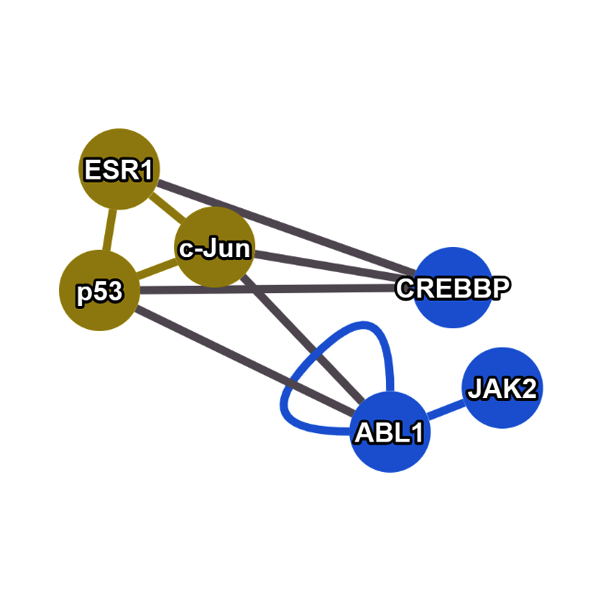
Tips:
* If the "Extended Search" option is checked, PINA will also search and show interactions between interacting proteins of the query protein(s), which could be time-consuming if there are a big number of interacting proteins in the network.
* If the "Same species" option is checked, PINA will only show interacting proteins with the same species as the query protein.
* If the "UniProt proteins" option is checked, PINA will only show interacting proteins with UniProt accession number (AC).
Integrated Network Viewer
A unified tool to view, filter, and analyze interaction networks
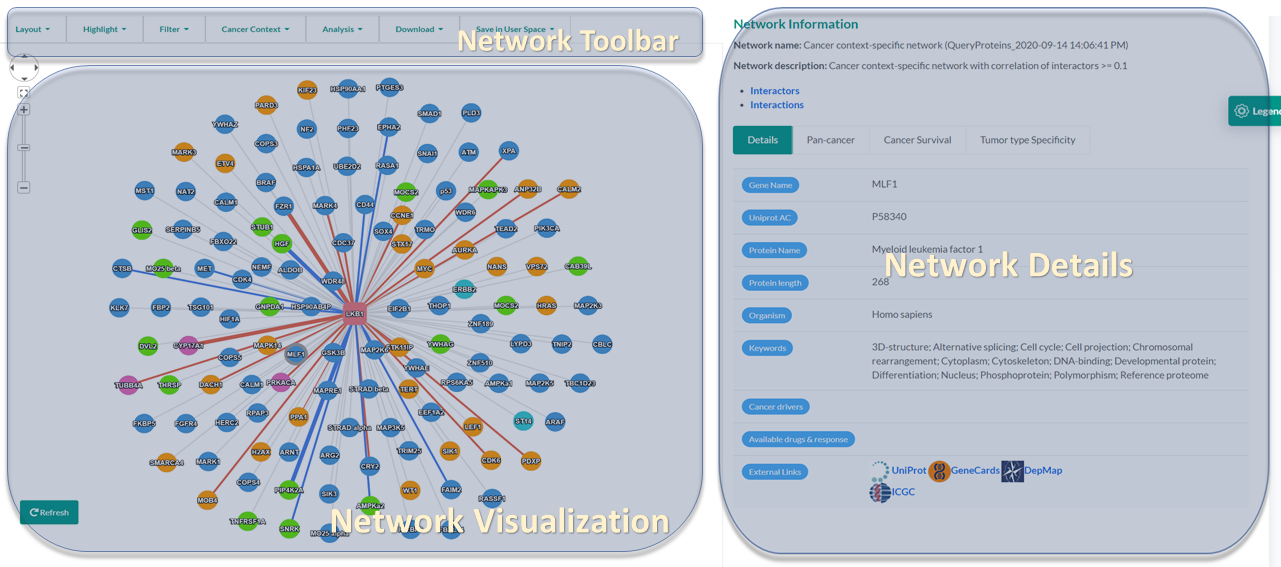
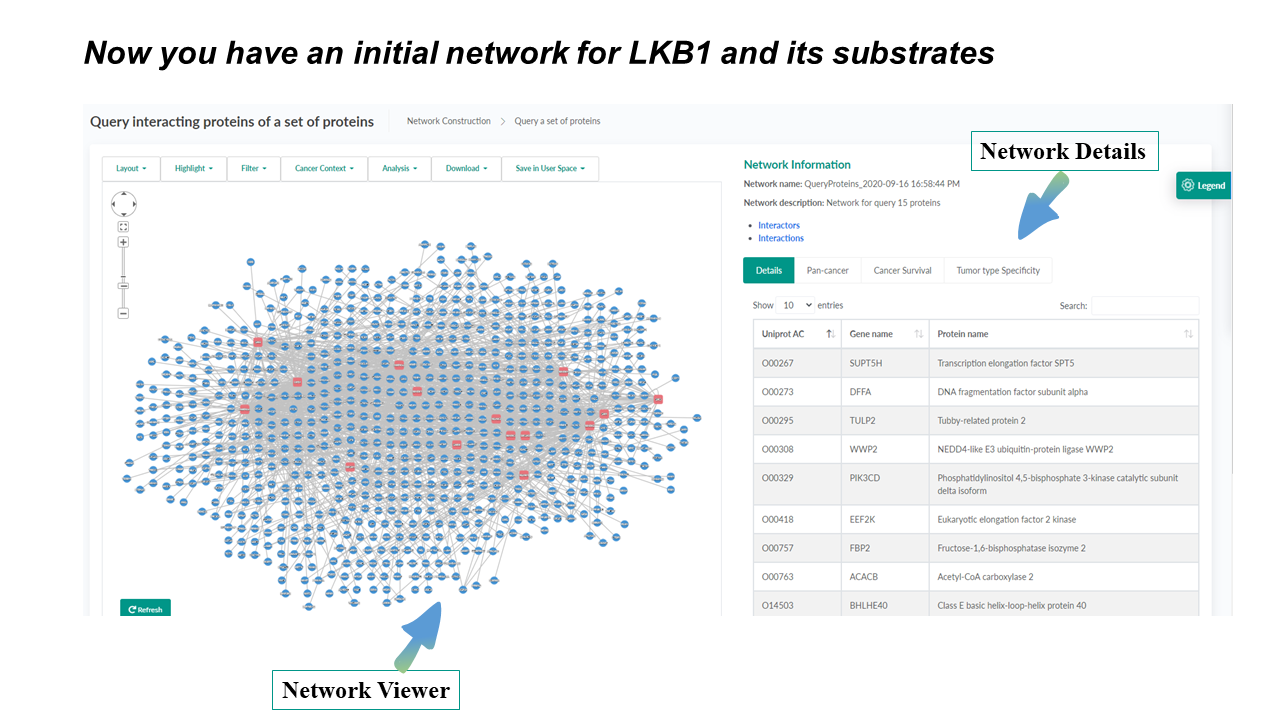
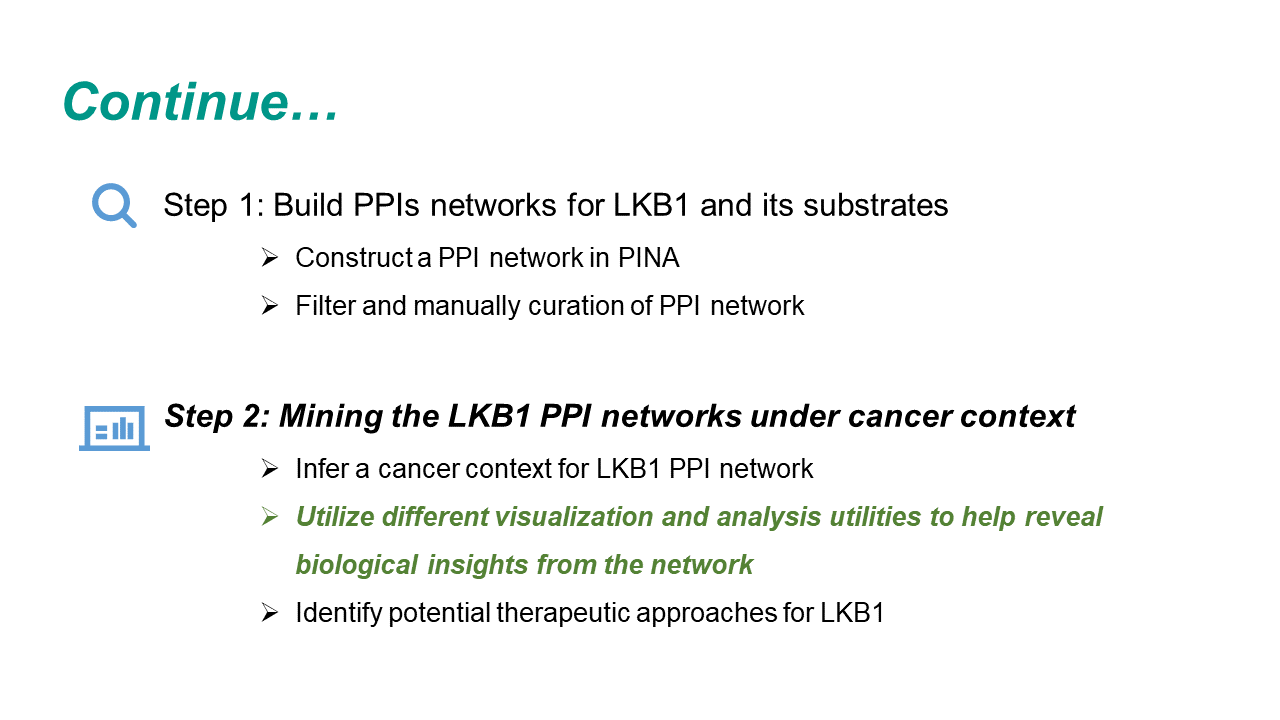
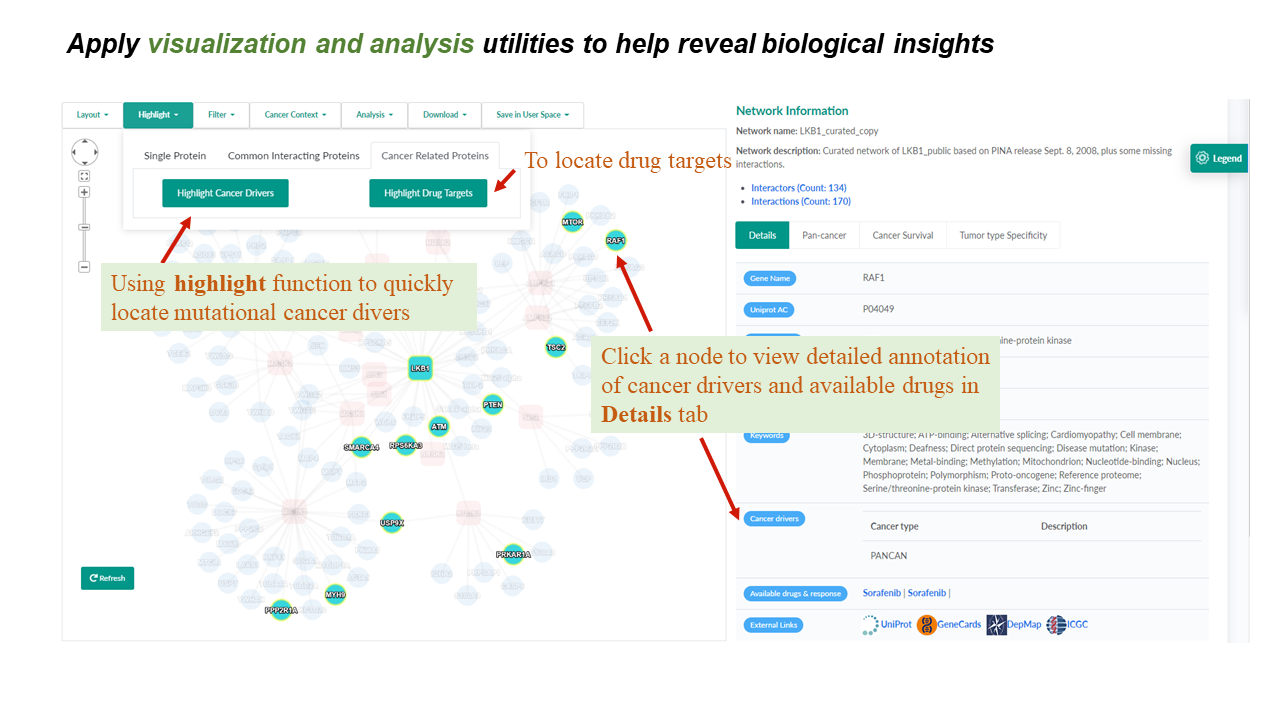
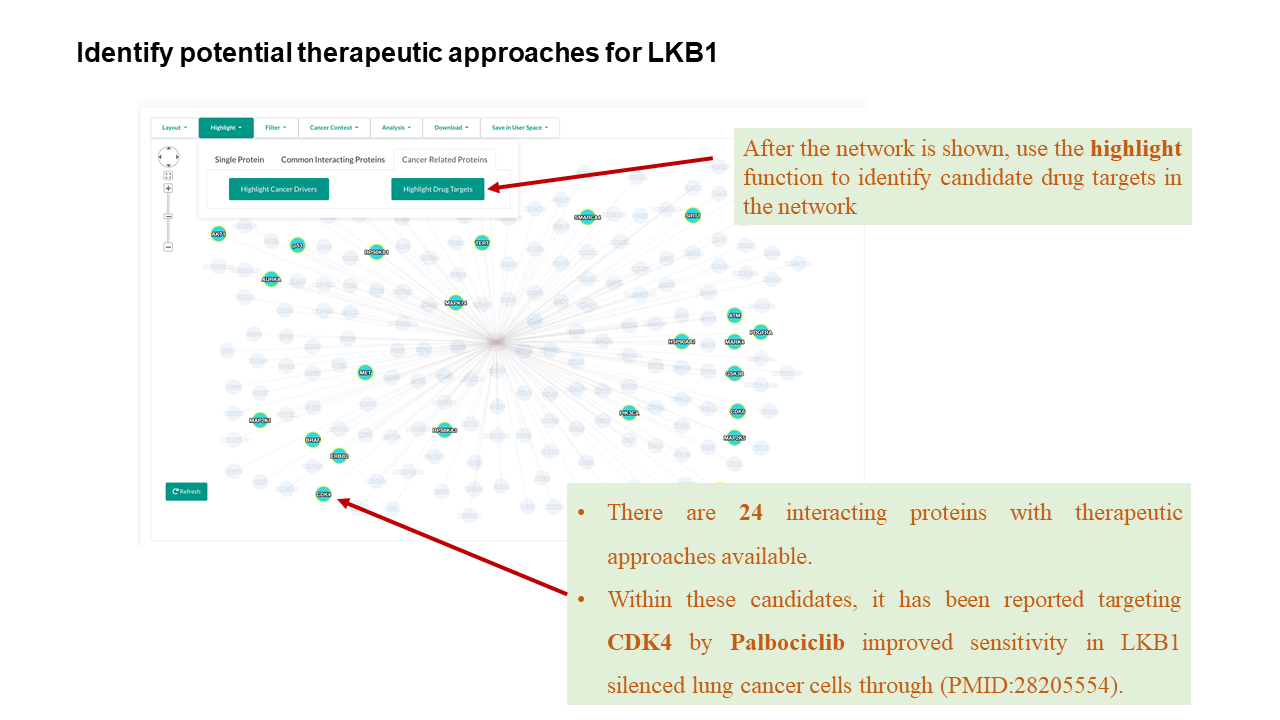
The network toolbar provides handy choices for changing layouts, highlighting user-selected or cancer-related proteins. It also seamlessly integrates functions of network filtering, analysis, downloading, and saving in User space, which makes it time-saving for users with different demands.
A new interactive network visualization tool was provided in PINA v3.0. The rendering speed and interactiveness have been improved significantly and numerous optimizations were introduced to help gain insights through the visualization of PPI networks.
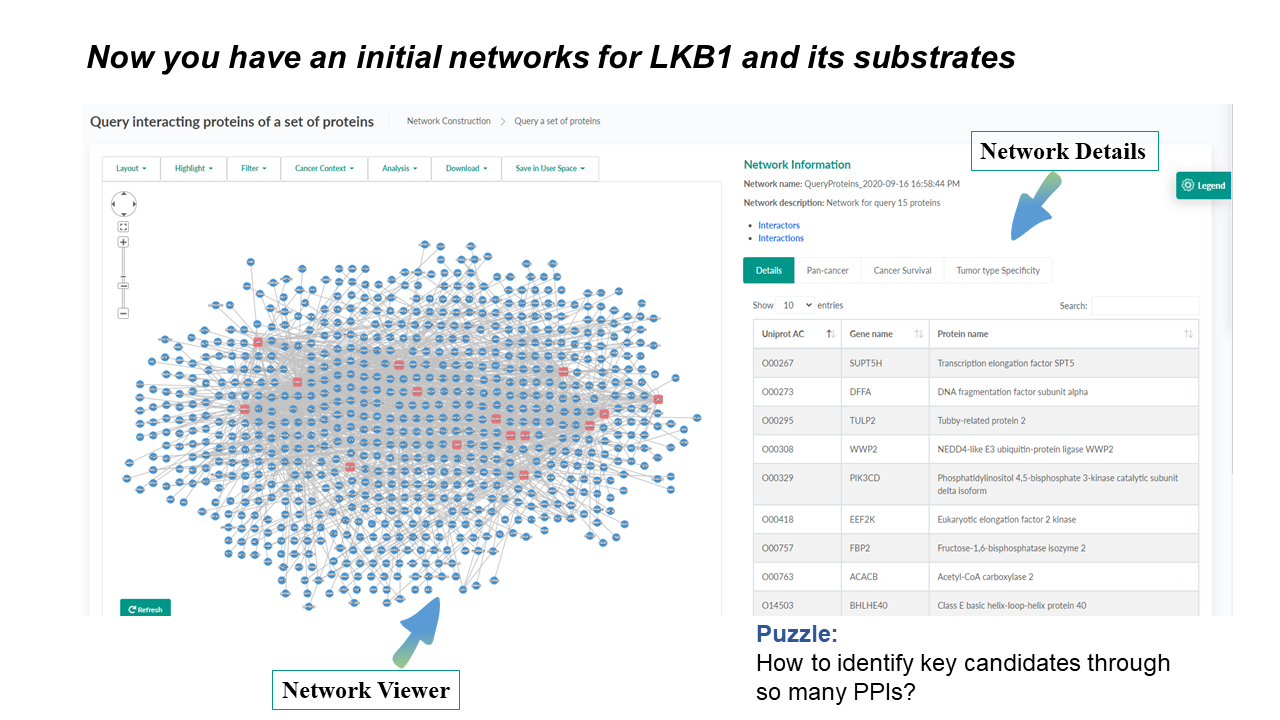
The network-details panel presents diverse rich information of interactors and interactions in a network. It is comprised of four tabs including reporting of network details using a sortable and searchable table, and a number of newly introduced cancer utilities (see the section Cancer Context and Protein/Interaction Details ). This panel is also highly interactive with the network-view panel, by dynamically showing corresponding information upon clicking a node or an edge in the network-view panel.
Network Visualization
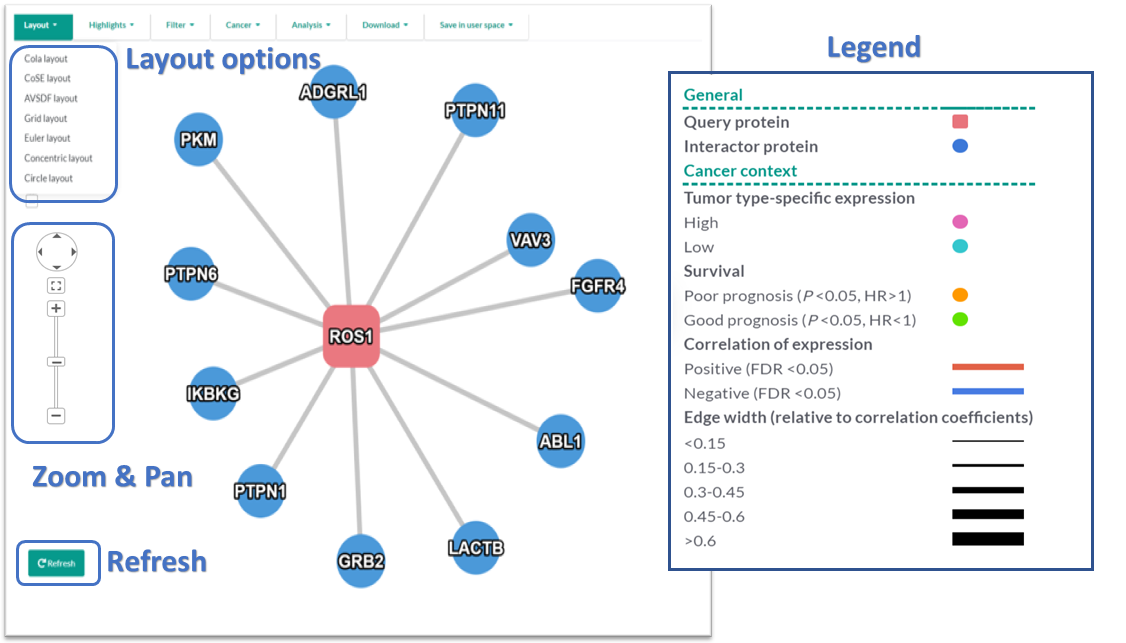
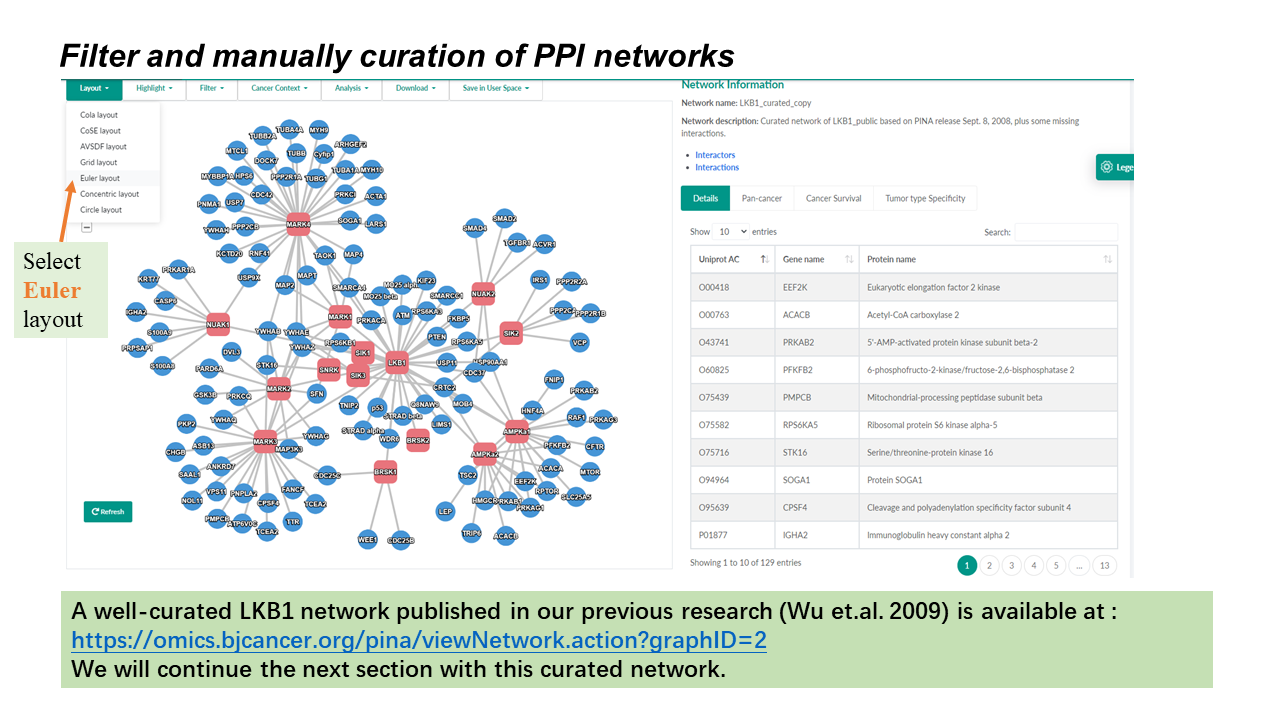
- Multiple network layouts were implemented using the layout extensions provided by Cytoscape.js.
- 'Cola' is the default layout. Users need to wait for the network to be loaded completely (when the nodes and edges stop moving/jittering) before changing the layout, because the default Cola layout dynamically simulates during the loading period, making it ineffective to change the layout meanwhile.
- Clicking the plus button (+) of the 'Zoom & Pan' plugin to zoom in the view, while the minus button (-) to zoom out.
- Clicking and holding your left mouse button at any blank space or using the navigating button of the 'Zoom & Pan' plugin to adjust the viewable area of the network.
- Clicking the refresh button to restore the default styles of the network, i.e., the effects of highlighting will be removed.
General Information
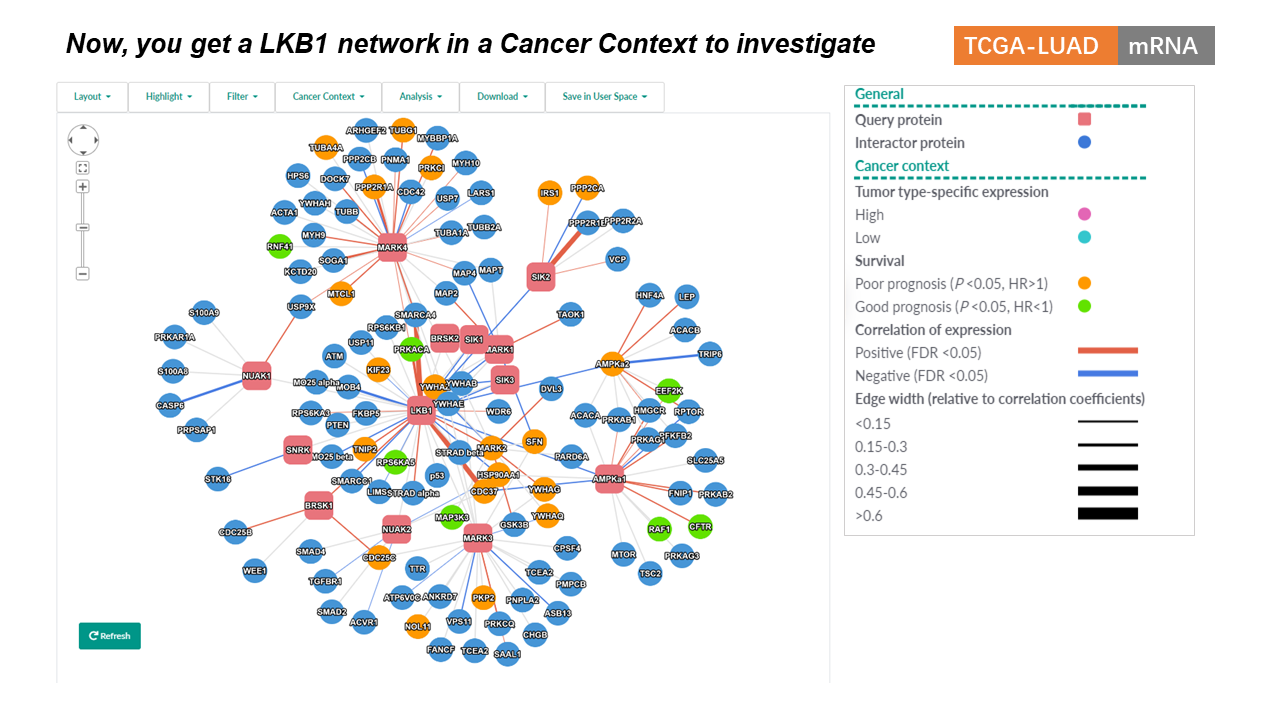
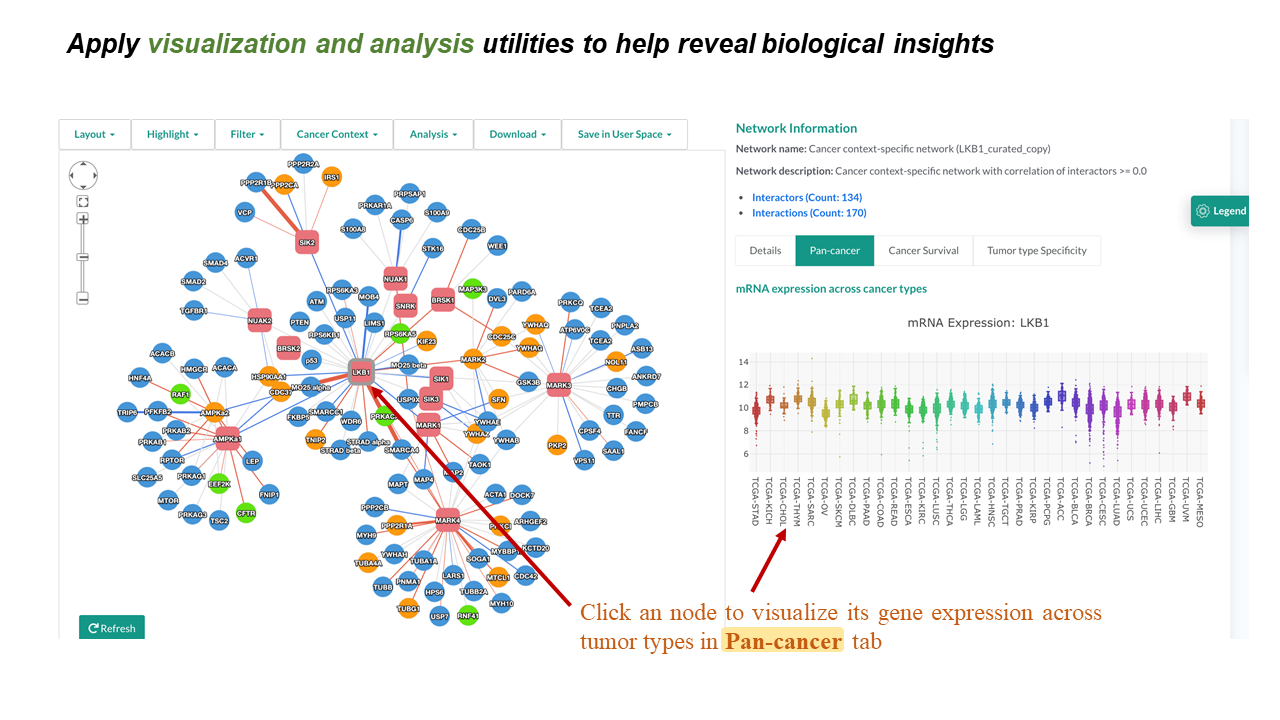
- Query Proteins are represented as red (hex color code: #e8747c ) rounded rectangles.
- Interacting Proteins are represented as blue (hex color code: #4695d6) circles.
- Genes with tumor type-expression specificity are nodes colored in pink (highly expressed) and cyan (lowly expressed).
- Candidate prognosis biomarkers in a specific tumor type are indicated as orange (poor prognosis) and green (good prognosis) nodes in the network.
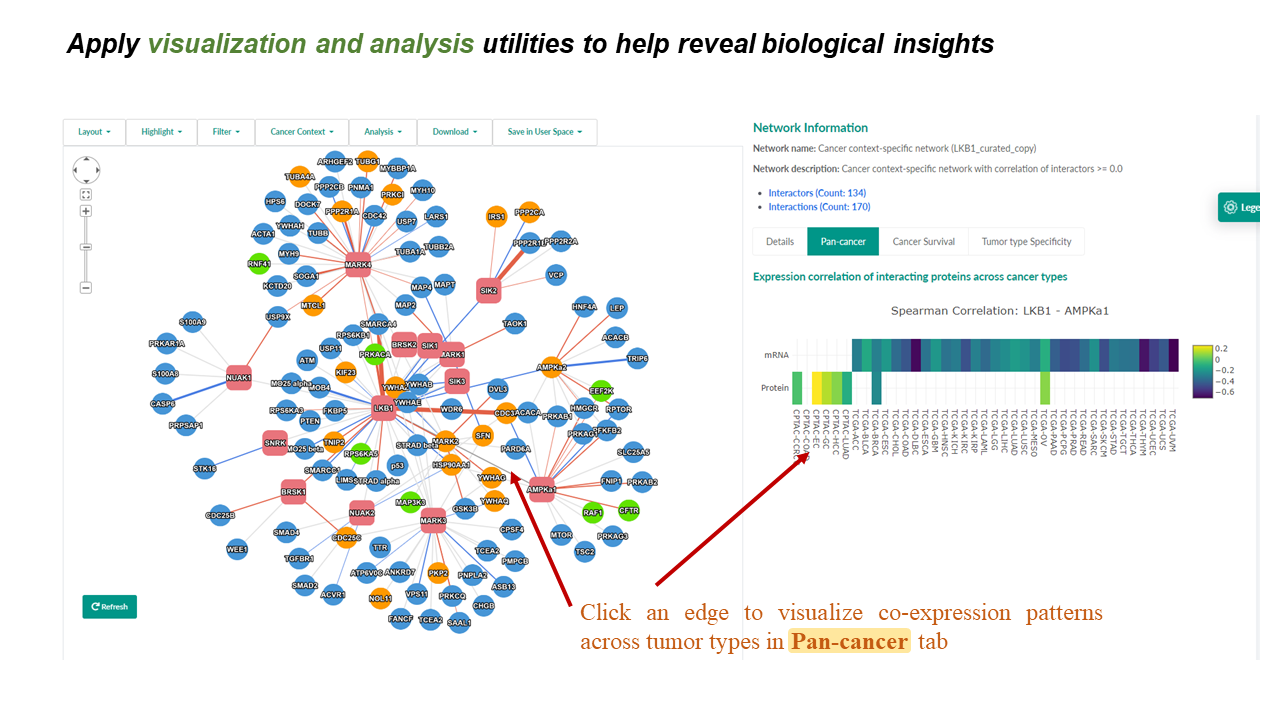
- Positive correlations with statistical significance between the expression levels of interacting proteins are represented as blue edges, while negative correlations are represented as red edges. Edge width is proportional to the correlation coefficients.
- See the section Cancer Context for details of relevant methods.
Network Filter
Get a more credible network by different criteria
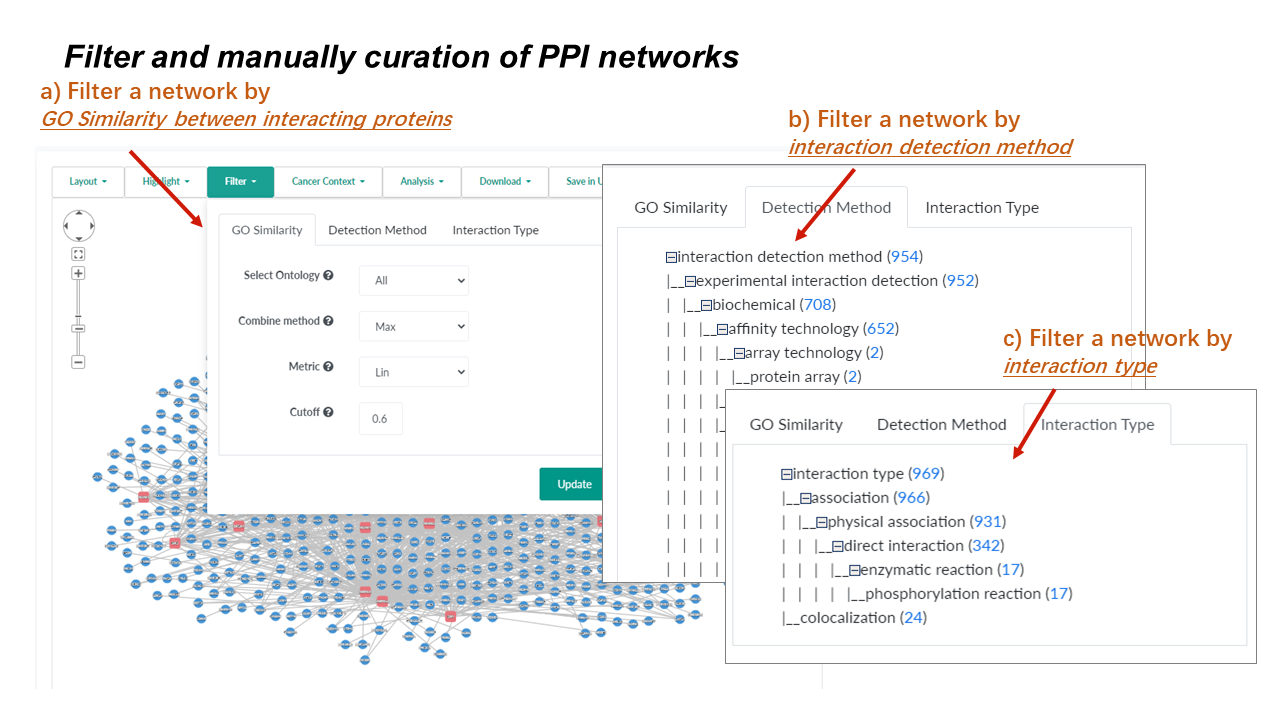
Go similarity tab to filter interactions based on the semantic similarity score between annotated GO terms of interacting proteins.
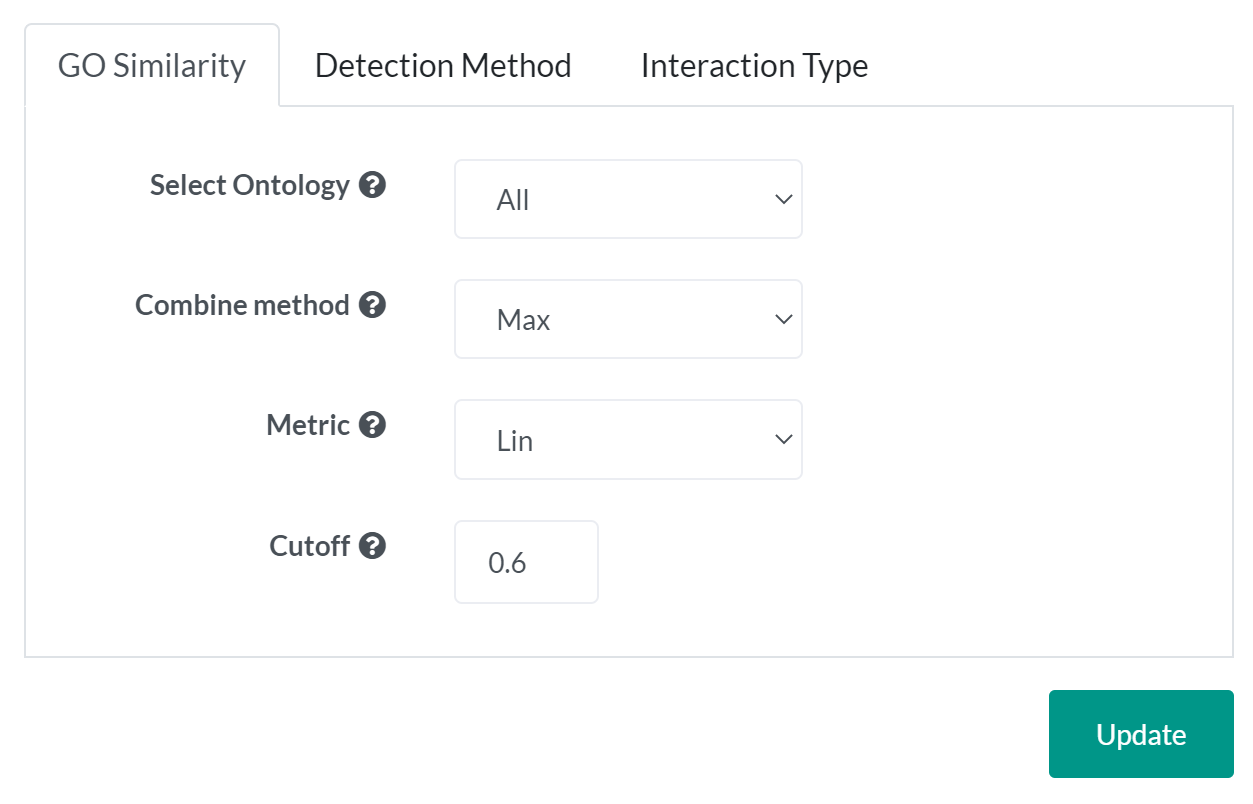
- A strategy of combining semantic similarity scores of multiple GO terms associated with a protein
- Max: Use the maximum similarity score over all pairs of GO terms between two proteins.
- Average: Use the average of similarity scores over all pairs of GO terms between two proteins.
- Rcmax: Similarities between GO terms form a matrix. The similarity is the maximum of RowScore and ColumnScore, where RowScore (ColumnScore) is the average of maximum similarities on each row (column).
- The method to calculate the semantic similarity measure.
- Lin: See An information-theoretic definition of similarity
- Resnik: See Using information content to evaluate semantic similarity in a taxonomy
- Jiang and Conrath: See Semantic similarity based on corpus statistics and lexical taxonomy
- Rel: See A new measure for functional similarity of gene products based on Gene Ontology
Detection method tab to categorize interactions by interaction detection methods.
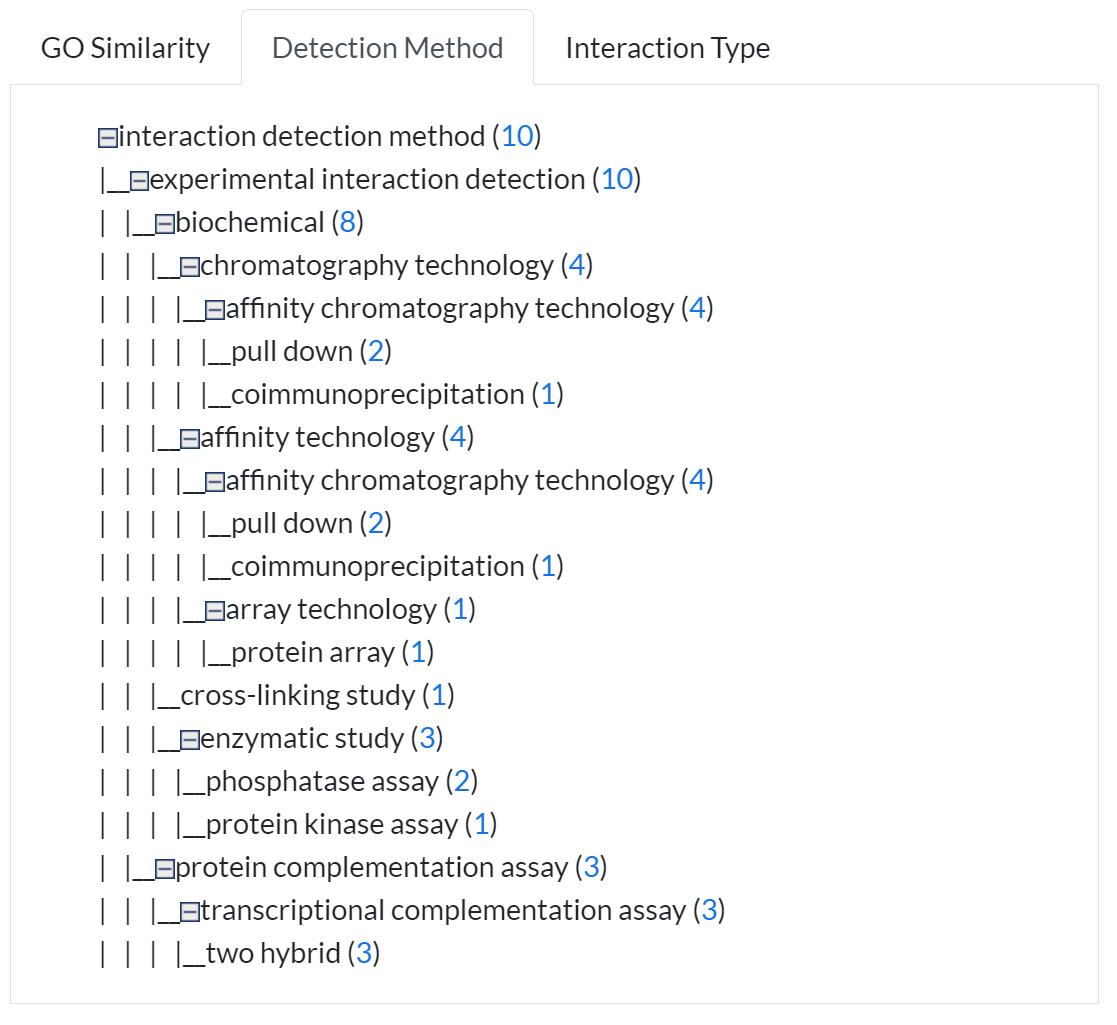
- All Detection methods used in the identification of PPIs in a given network will be listed at the Filter (Detection Method) tab.
- Clicking a link will show all interactions identified by the selected detection method in the original query network.
Interaction type tab to categorize interactions by the type of interactions.

- All interaction types that can be found in a given network will be listed at the Filter (Interaction Type) tab.
- Clicking a link will show all interactions reported as the selected interaction type in the original query network.
Cancer Context
Infer cancer-context for a PPI network
Cancer Context menu allows users to infer the cancer context of a PPI network for a specified tumor type using integrated expression and clinical data from TCGA and CPTAC studies, as well as annotations from GDSC and etc..
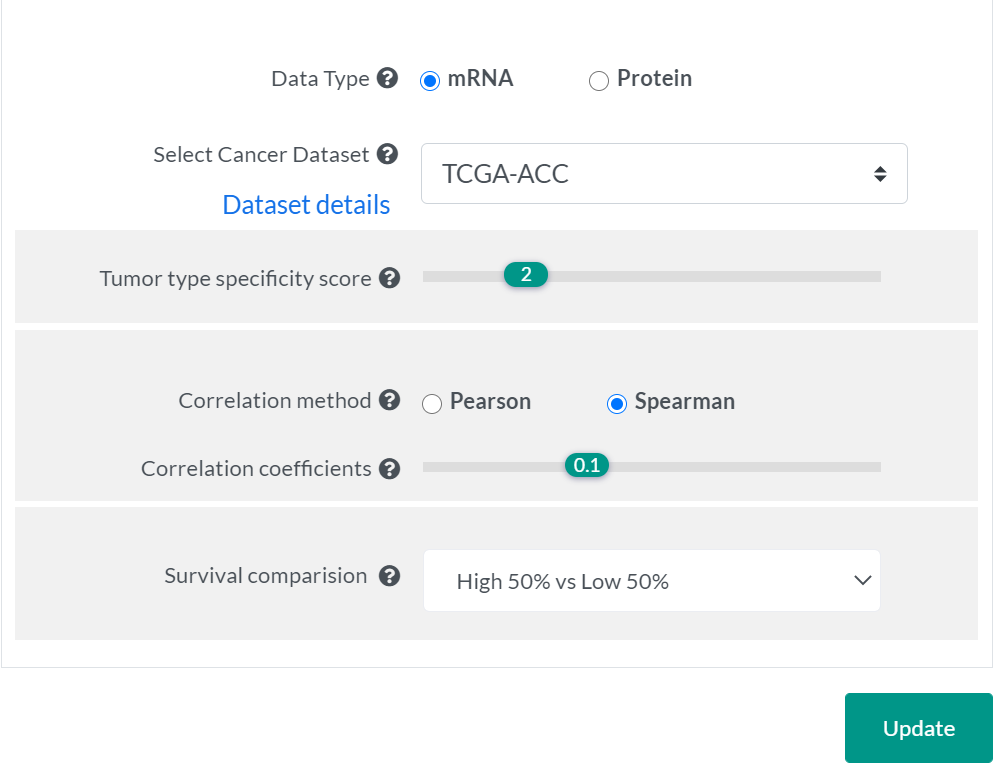
- Select Data Type will update the associated available cancer datasets automatically.
- Abbreviations of cancer types and details for original data source are listed here.
- RNA-seq profiles include 9,870 tumors across 33 cancer types from TCGA.
- Mass spectrometry-based proteomic profiles include 936 tumors across 8 cancer types from CPTAC.
- Tumor type specificity scores were pre-calculated for each gene to represent the level of deviation of expression in a given tumor type compared to the full spectrum of tumor types. The default cutoff of specificity score was set as 2 for mRNA expression levels, as suggested in previous studies. Genes having a specificity score > 2 are considered as highly-expressed in the analyzed tumor type, and genes having a score < -2 were considered as under-expressed. As the proteomic datasets that PINA integrated were profiled by iTRAQ or TMT labeling methods, protein abundances were quantified relative to pooled samples or paired normal tissues. This resulted in a distribution different from mRNA levels, thus we set the cutoff as 0.5 by default for protein abundances, to have reasonable numbers of proteins with tumor type-expression specificity in each dataset.
- Users can also change this cutoff at their will during analysis of a PPI network.
- Pearson and Spearman correlation methods are both available for correlation analysis.
- Users can specify a cutoff of correlation coefficients to only keep interactions with a higher level of expression correlation between interacting proteins in a given cancer type.
- Patients will be divided into two groups based on the selected cutoff for survival analysis.
- Proteins, which expression is significantly associated with
patient outcome in a given cancer type, will be
highlighted in a network in different colors.
- Good prognosis markers (Log-rank test P-value <0.05, hazard ratio <1) are colored in green (hex color code: #62e200).
- Poor prognosis markers (Log-rank test P-value <0.05, hazard ratio >1) are colored in orange (hex color code: #ff9900).
Protein/Interaction Details
Help identify key candidate proteins/interactions
Protein Details
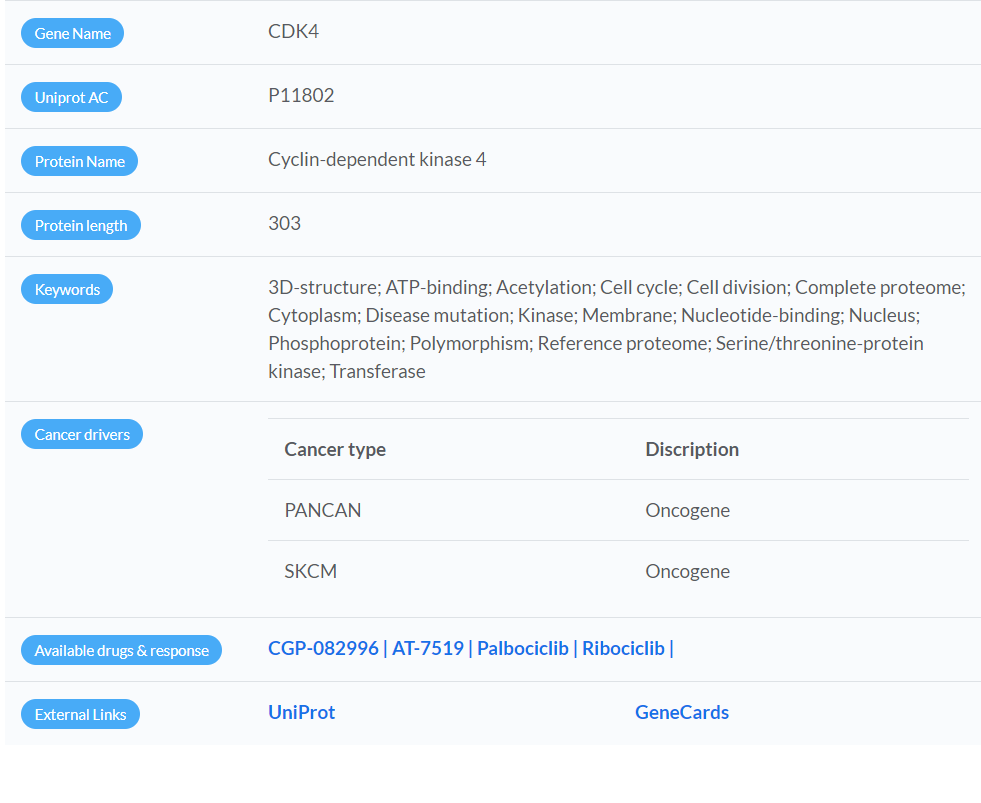
- Tumor type-specific cancer driver genes were characterized by a recent TCGA pan-cancer analysis of 9,423 tumor exomes.
- PANCAN: Results were based on the pan-cancer analysis.
- Cancer type (TCGA project code): Results were based on tumor type-specific analysis ( Table listing abbreviations of cancer types).
- Therapeutic compounds targeting the selected protein are listed, and each compound is linked to the (GDSC) website for its pan-cancer (> 1,000 human cancer cell lines) or cancer type-specific pharmacogenomic analysis results depending on the context of a PPI network.
- If there are multiple links for a compound, these are links referred to GDSC 1 and GDSC 2 results respectively.
Interaction Details
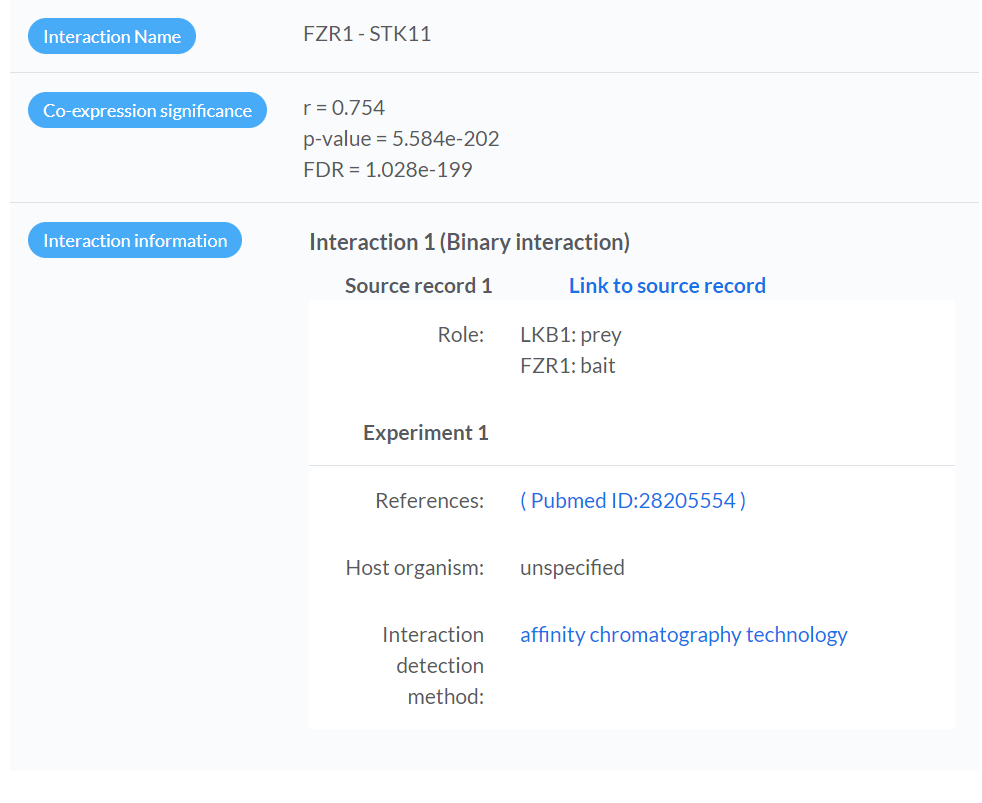
- Showing the results of expression correlation analysis (based on the inferred Cancer Context ) for the pair of interacting proteins, which is selected in the network visualization panel.
- The evidence and reported publications from source databases will be shown.
Pan-cancer
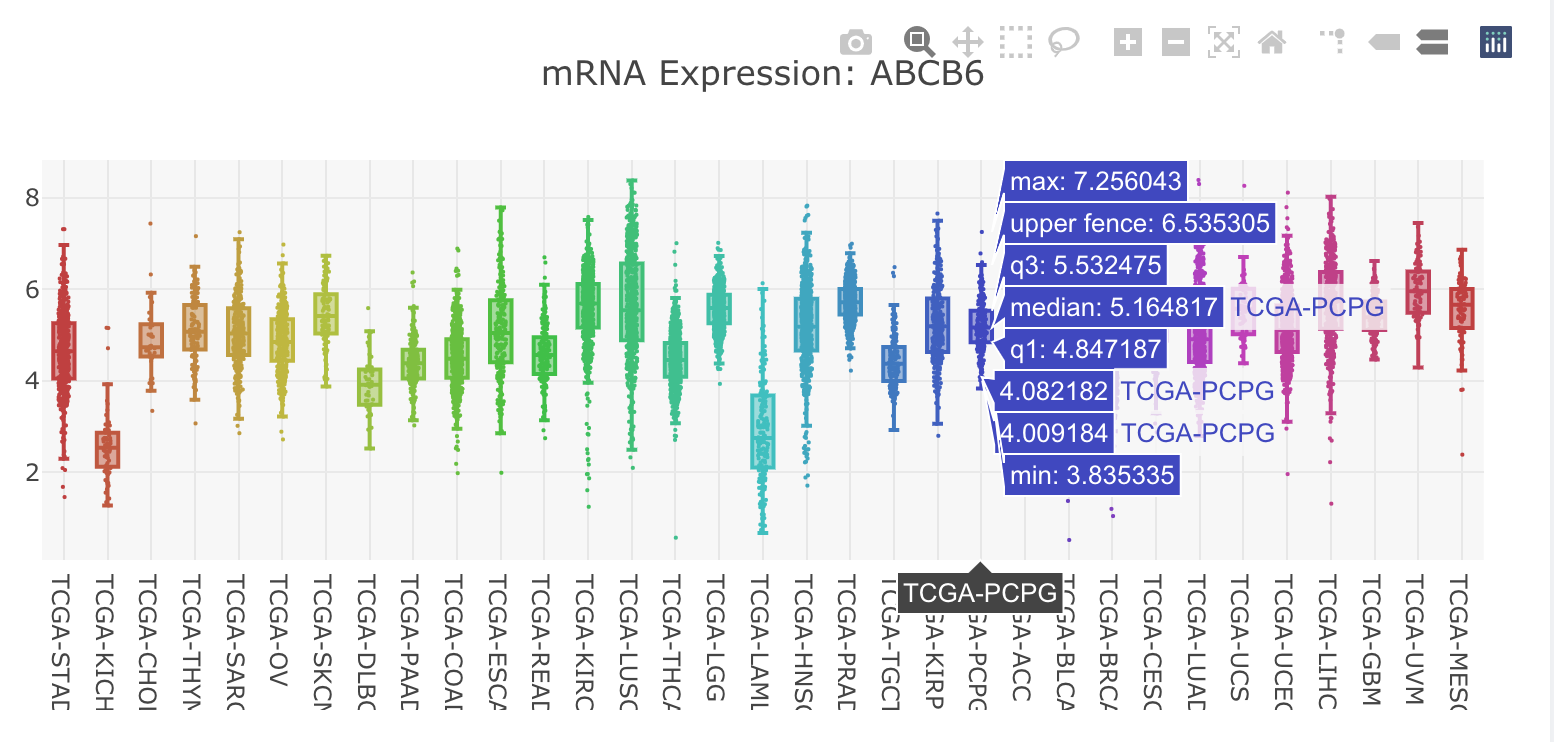
- Clicking a node in the network-visualization panel will display the mRNA expression distribution across cancer types for the selected gene in the "Pan-cancer" tab.
- Boxplots show expression distribution of the selected gene for each TCGA cancer type. Check here for details of the datasets.
- Moving the cursor to a boxplot will show the summary numbers of the expression distribution in this cancer type.
- An image toolbar is available on the top right corner.
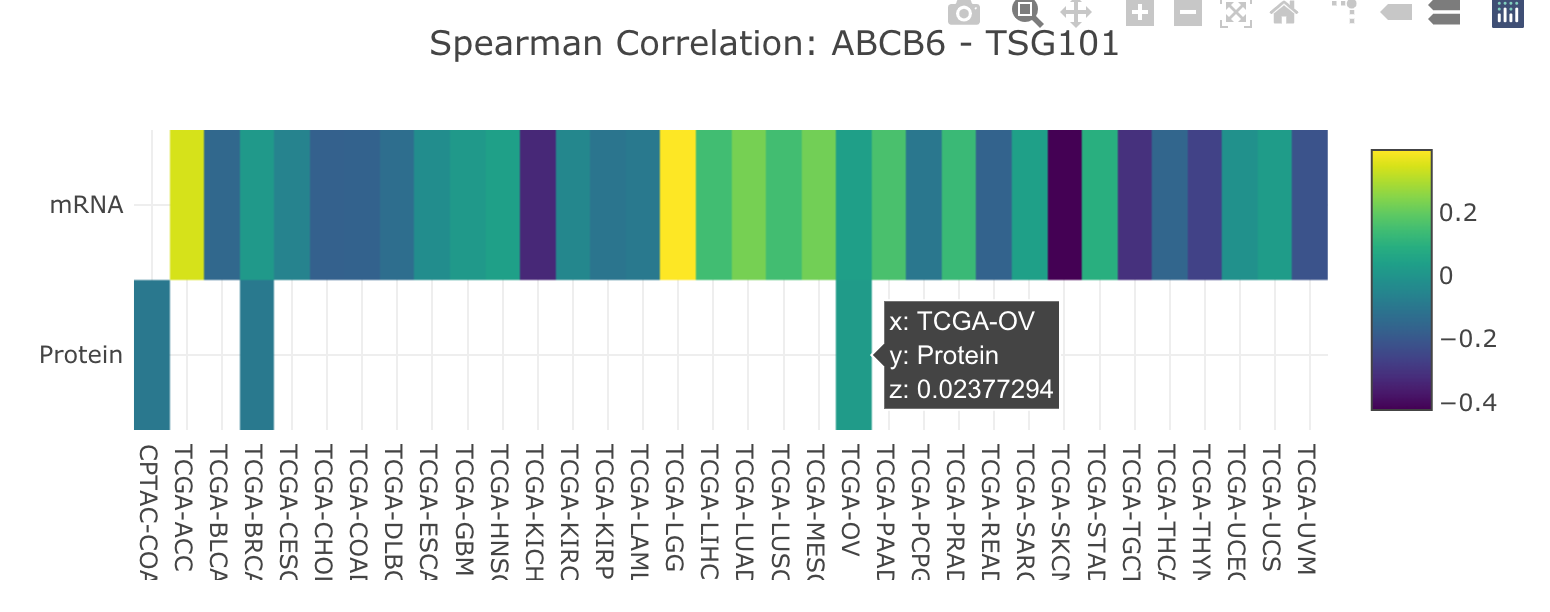
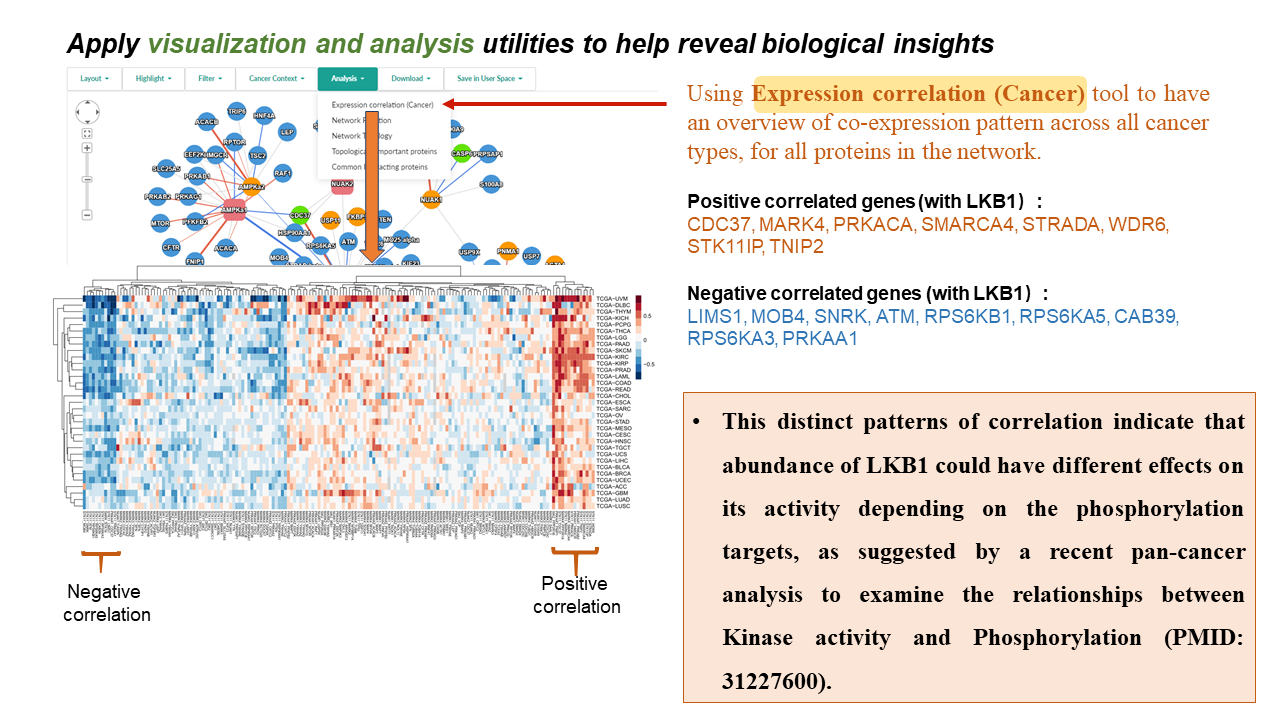
- Clicking an edge in the network-visualization panel will display an expression correlation heatmap for the selected pair of interacting proteins in the "Pan-cancer" tab in the network-details panel.
- Heatmap shows the correlation coefficients of mRNA expression (top row) and protein abundance (bottom row) between this pair of interacting proteins in each tumor type.
- Move the cursor to a cell will show the details, and z is the correlation coefficient in this cancer type.
- An image toolbar is available on the top right corner.
Cancer Survival
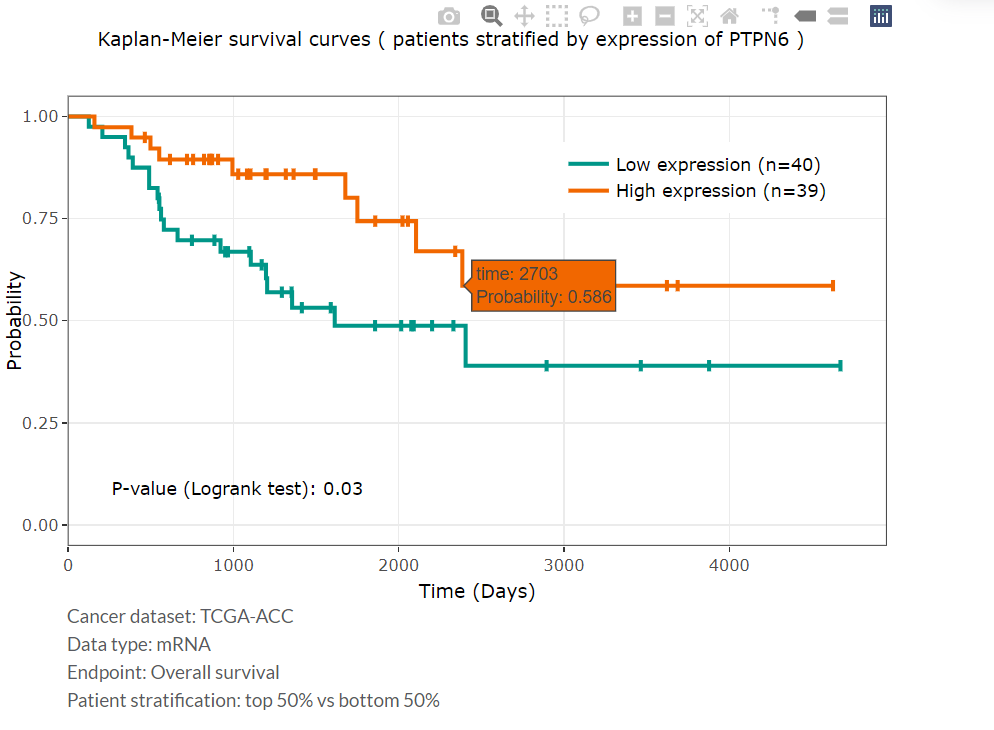
- Patients will be stratified into two groups, based on the expression of the selected protein in the specified tumor type, for comparing survival differences.
- Overall survival (OS) was used as the clinical endpoint.
- P-value was calculated by the Log-rank test for Kaplan-Meier analysis, and P-value less than 0.05 was considered statistically significant.
Tumor type expression specificity
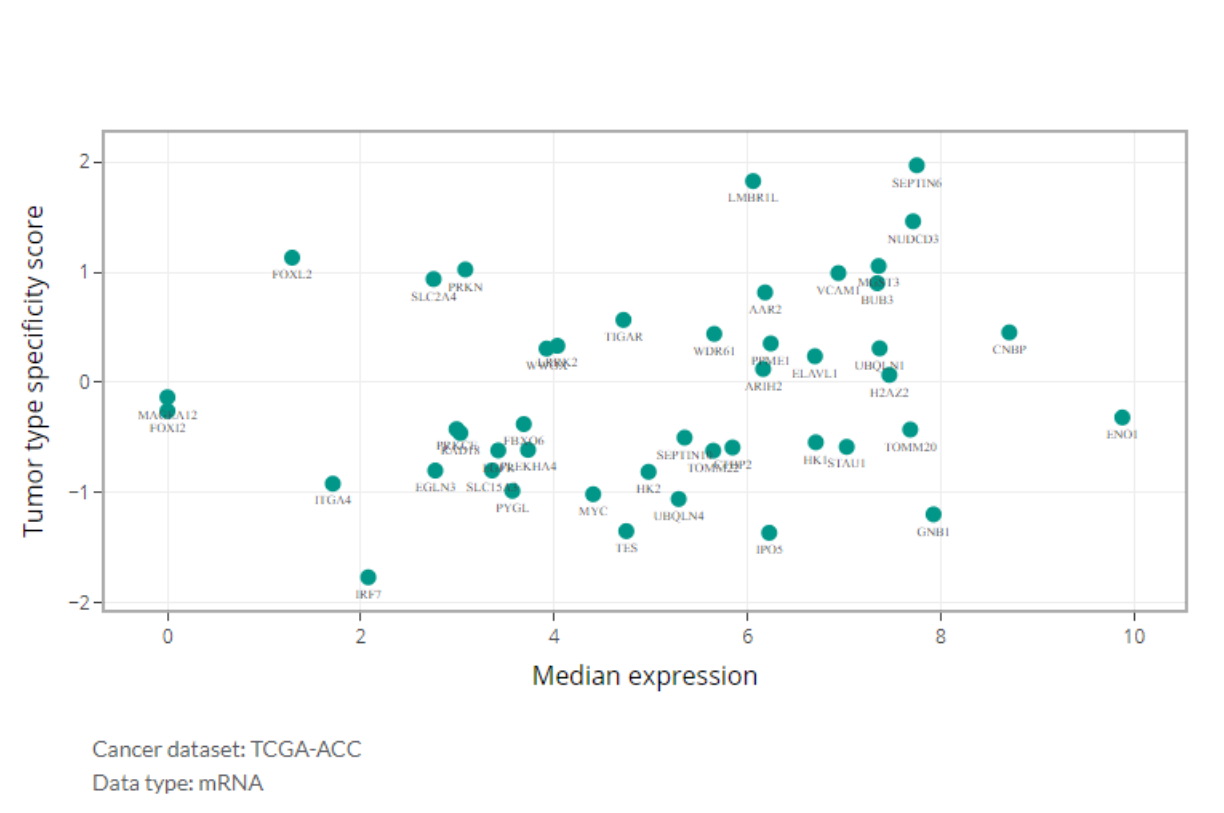
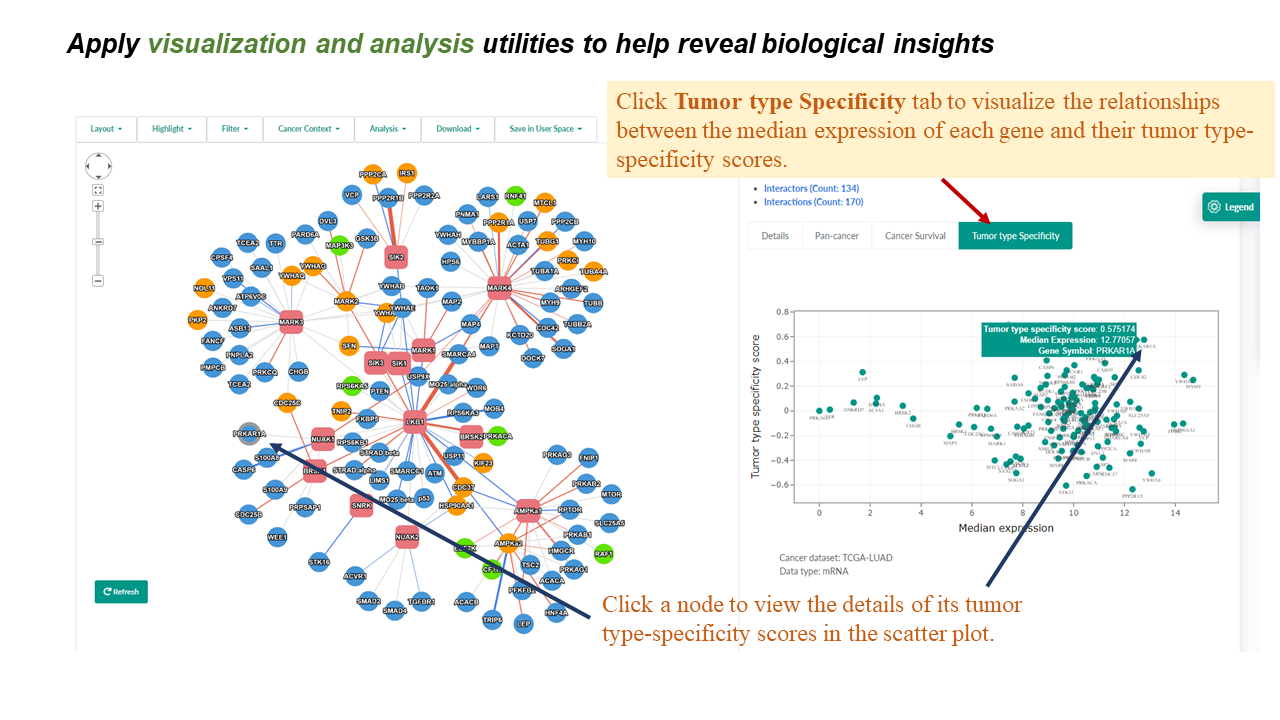
- This scatter plot illustrates the relationships between the median expression of each gene in the analyzed PPI network and their tumor type-specificity scores.
- Tumor type specificity score was calculated using the method reported by Sonawane et al, which compared the median expression level of A gene in the given tumor type to the median and interquartile range (IQR) of its expression across all tumor types.
- Specificity scores were calculated for mRNA and protein expression datasets respectively.
Network Download
Download data at your hands
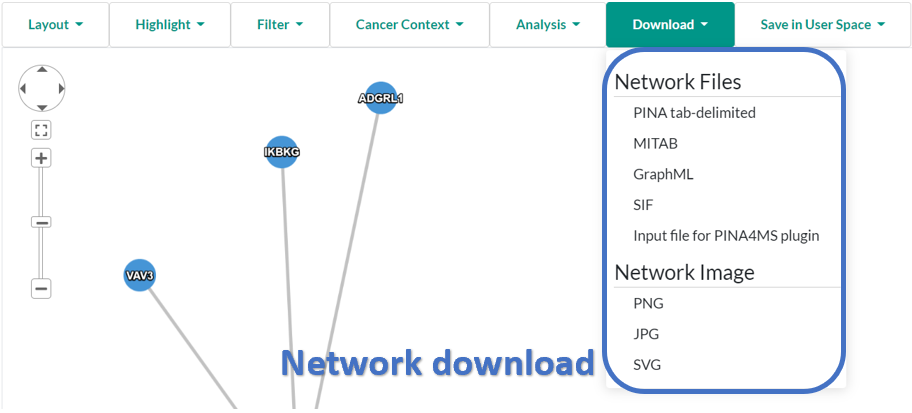
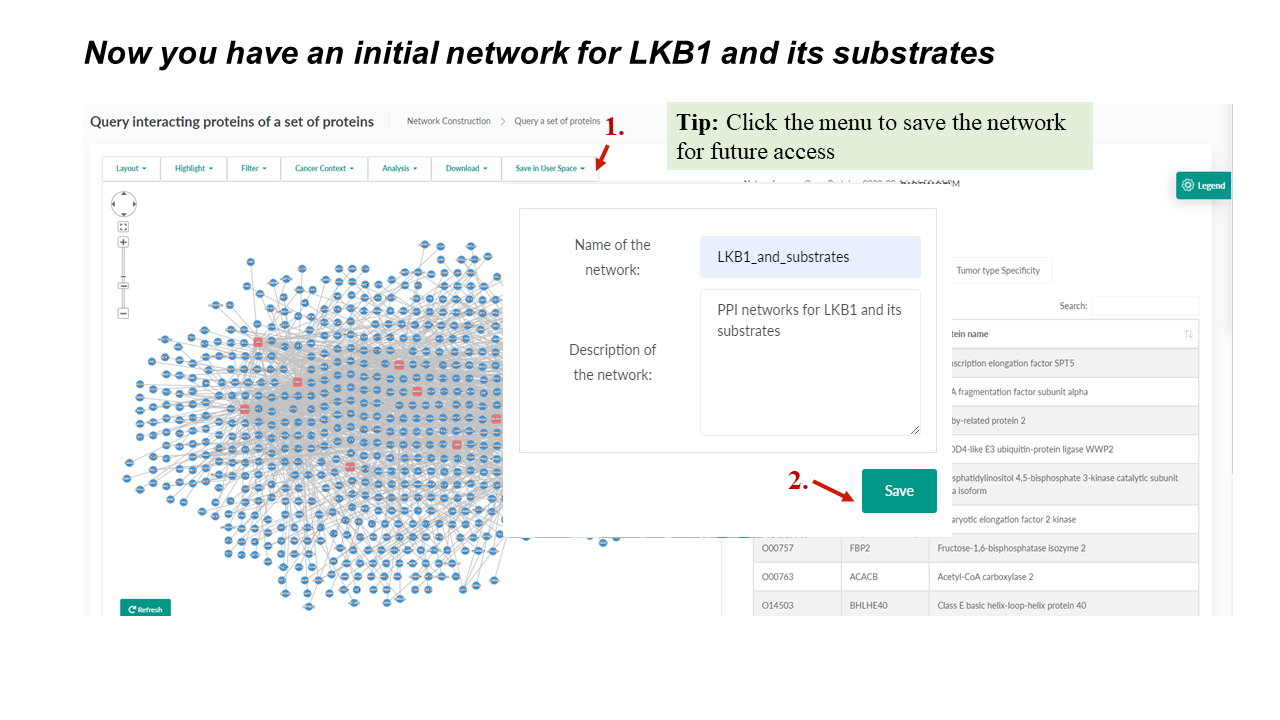
- Interaction networks can be downloaded to local disk with GraphML format, MITAB format, or PINA tab-delimited format.
- GraphML: a XML format for graph representation. Node elements describe gene name, protein name, UniProt AC, GO terms of proteins; edge elements describe the interaction of proteins. See the example file.
- MITAB (PSI-MI tab-delimited format): columns are explained by the header line in the example file. The file can be opened by Excel with selecting tab as the delimiter.
- SIF (Simple Interaction File): This format can be imported into Cytoscape directly. The disadvantage is that annotation is not included.
- PINA tab-delimited format: the 1 to 3 columns are UniProt AC, UniProt keywords of one interacting protein; the 4 to 6 columns are corresponding information of the other interacting protein; the left columns are interaction ID of source databases. See the example file. The file can be opened by Excel with selecting tab as the delimiter.
Network Analysis
Gain the insight into the network
- Expression correlation (Cancer) analysis calculates expression correlation coefficients between all pairs of interacting proteins in a specified network for each available cancer datasets, which results will be presented as an interactive heatmap.
- Network Function analysis identifies enriched GO terms in the PPI network by comparing GO frequencies in the given network against the background distribution, i.e. the distribution of GO terms of the whole organism. GO is structured as a hierarchical directed acyclic graph (DAG), which was taken into account when counting the number of annotated proteins. A protein is thought associated with a certain GO term if it is annotated with the term itself or a child of the term.
- Network Topology
analysis gives
an overview of network
topological features including
diameter,
degree
distribution,
shortest
path distribution, and
clustering coefficient
of the interaction network.
- Path: In a protein-protein interaction network, nodes represent proteins, and edges represent interactions. Path between two nodes is defined as a list of nodes where each node has an edge to the next node.
- Shortest path: defined as the shortest path from one node to another in the network.
- Diameter: defined as the maximum value of the distance of the shortest path over all pairs of distinct nodes in the graph.
- Degree distribution: measures the proportion of nodes in a graph with a specified number of edges.
- Shortest path distribution: measures the proportion of the shortest path in the graph with a specified length.
- Clustering coefficient: tells how well-connected neighbors of the node is. The value is 1 when neighbor nodes are fully connected and 0 when none of the neighbor nodes are connected. See the formal definition.
- Topologically Important Proteins analysis applies centrality measures to identify topologically important proteins in the interaction network. Four centrality measures including eigenvector centrality, betweenness centrality, closeness centrality, and degree centrality are implemented in PINA to determine the relative importance of a node (protein) within the graph (interaction network). See formal definition.
- Common Interacting Proteins analysis identifies proteins that interact with at least two of the query proteins in the network.
Interactome Modules
Network modules generated from PINA Interactomes
- Module Collection is a set of network modules identified from PINA interactomes using a specific clustering algorithm and parameter setting. The detail can be viewed from module collection links in the search result page.
- Module Annotation gives a brief view of functions of Interactome modules using public knowledge including Gene Ontology, KEGG pathway, and PFAM domains. In the search result page, only the top 3 terms in each annotation source are shown, click "view annotation details" will give you the full list.
- Search modules to search predefined Interactome modules are with query genes.
-
Identify
enriched
modules to identify statistically enriched Interactome
modules in
query genes using the hypergeometric test.
- Sample Number: There are two numbers in this column. The first one is the number of query proteins found in this module; the second one is the total number of query proteins.
- Background Number: There are two numbers in this column. The first one is the total number of proteins in this module; the second one is the total number of proteins of one species with known interactions in PINA.
Functions for registered users
User Space
Login
Network Operation
Network operation produces a network from two existing networks based on the following operations.- Union operation will generate a network containing all proteins and interactions in two networks.
- Subtraction operation will generate a network containing proteins and interactions, which only belong to the destination network.
- Intersection operation will generate a network containing common proteins and interactions of two networks.
- Difference operation will generate a network containing proteins and interactions, which are not common to two networks.

